Note
This technote is not yet published.
Abstract
The Large Synoptic Survey Telescope (LSST) plans to produce a live stream of its detections of transient astronomical events within 60 seconds of observation at an expected rate of about 10,000 alerts per visit and 10 million per night. According to the VOEvent database archived by 4piSky, existing technology supports a current alert stream rate of ~43,000 per month. Additionally, the LSST alerts are expected to be significantly larger in size than past alerts given the plan to include cutout “postage stamp” images with each alert event packet. In anticipation of supporting an alert stream unprecedented in size and velocity, we are experimenting with streaming technology that is used at large scale outside of astronomy that may be suitable for our use case. Here we benchmark the performance of an alert distribution testbed using this streaming technology.
Introduction
Current performance requirements on the LSST alert system expect to distribute at minimum nAlertVisitAvg = 10,000 alert events every 39 seconds, with a stretch goal of supporting 100,000 per visit.
This minimum averages to ~250 alerts per second, though may be transmitted at a higher, much more bursty rate, compared to the current VOEvent rate of ~1 alert per minute.
The LSST alerts are planned to contain a significant amount of information in each alert event packet,
including individual event measurements made on the difference image, a measure of the “spuriousness” of the event,
a limited history of previous observations of the object associated with the event if known, characteristics of the variability of the object’s lightcurve,
the IDs and distances to nearby known objects, and cutout images of both the difference image and the template that was subtracted.
The experiments here use a template alert event packet as described below with very limited content (e.g. no history) with a size of 136 KB, primarily dominated by the 90 KB size of the two cutout images in FITS format.
A full alert packet with all event measurements and a history of previous observations will be larger.
On the receiving end of the alert distribution system will be community brokers and a limited filtering service mini-broker.
The LSST filtering service is expected to be able to support numBrokerUsers = 100 simultaneous connected users each receiving at most numBrokerAlerts = 20 full alerts per visit.
In order to meet LSST’s alert stream needs, the alert distribution system must be able to scale to support the expected volume of the alert stream, to support the number of connections, and to allow filtering capabilities that can be made user friendly with simple Python or SQL-like language.
Here we test the scalability of a preliminary mock alert distribution system testbed.
Technology Suite
For alert distribution, serialization, and filtering, we are testing primarily three open source technologies supported by the Apache ecosystem: Kafka, Avro, and Spark.
Kafka
For alert distribution, we are testing Apache Kafka. Kafka is a logging system or messaging queue reinvented as a distributed streaming platform. It is highly-scalable and used in production at companies like LinkedIn, Netflix, and Microsoft to process over a trillion messages per day. Originally out of LinkedIn, the development of Kafka is supported by the company Confluent, which also provides an ecosystem of tools around Kafka. The Kafka ecosystem has well-supported clients in a number of languages including C/C++ and Python.
Avro
For alert formatting, we are using Apache Avro.
Avro is a data serialization system similar to Thrift or Protocol Buffers that provides more structure to data than XML or JSON.
Avro uses schemas, similar to a CREATE TABLE SQL database statement, defined with JSON to describe data structures and data types.
Postage stamp cutout files can be included in alert packets as bytes type.
Spark
For alert filtering, we are experimenting with Apache Spark. Spark is a computing platform in the Hadoop ecosystem for big data. The key relevant feature for this work is Spark Streaming, which allows a simple way to write streaming applications in way similar to tradition batch jobs. Spark Streaming allows for alert filters to be written in simple familiar Python and can be natively connected to Kafka. The initial benchmarking results here do not include filtering with Spark, but we mention it here for because of its fit in the choices for the overall ecosystem.
Benchmarking Experiments
To construct a testbed, we built a containerized suite of simple alert “producers” and “consumers” that serializes an example alert event and talks to a Kafka broker.
Tooling
The main testbed of alert consumers and producers to Kafka can be found in the lsst-dm organization’s “alert_stream” GitHub repo. This repo provides instructions for a Docker build and a Dockerized deployment of Kafka and Zookeeper from the Confluent Platform version 3.2.0. The example alert data and schemas for Avro serialization are pulled into the main Docker image and can be found in lsst-dm organization’s “sample-avro-alert” GitHub repo, including postage stamp cutout files in FITS format. Examples of how to use Spark Streaming with Avro and Kafka can be found in the lsst-dm organizations’s “filtering-blueprints” GitHub repo.
For monitoring the ecosystem deployment with Docker Swarm, we used “swarmprom”, a monitoring suite for Docker Swarm that uses Prometheus, Grafana, cAdvisor, Node Exporter and Alert Manager.
Initial Benchmark
As a first benchmark, we deployed one Kafka broker and one Zookeeper listening to a single alert producer serializing and sending 1,000 alerts (~rate expected from the Zwicky Transient Facility) repeatedly every 39 seconds with two alert consumers on the receiving end of the alerts for 1000 visits or 1 million total alerts. This ZTF scale test will be supplemented by larger scale tests to derive scaling curves.
The system was run on Amazon’s Web Services (AWS) using the Docker for AWS CloudFormation Template. The Docker Swarm size was set to a cluster of 3 Swarm managers and 5 Swarm worker nodes. All managers and workers were set to r3.xlarge EC2 HVM instance size with 200 GiB standard ephemeral storage. The r3.xlarge flavor is a memory optimized flavor with 4 vCPUs, 2.5 GHz, Intel Xeon E5-2670v2, and 30.5 GiB memory.
Results
For one producer generating 1000 alerts per visit x 1000 visits with two consumers (consumer1 counts all and prints every 100th alert and consumer2 just prints the latest offset from Kafka), no alerts were lost in transit. The average time for 1000 alerts to be generated, sent to Kafka, and received by the consumer was ~4.2 seconds.
Timing Mean +/- Stddev Min-Max Producer serialization and send to Kafka 3.88 +/- 0.25 s 3.37 - 4.32 s Transit time to receipt by consumer 0.30 +/- 0.23 s 0.06 - 1.05 s
The following measurements were derived from observations output every 5 minutes over the ~11 hours of generating 1 million alerts.
CPU (%) Mean +/- Stddev Max Kafka 9.0 +/- 3.8 39.0 Zookeeper < 0.1 +/- 0.1 1.3 Producer 23.9 +/- 6.4 44.8 Consumer1 8.3 +/- 2.4 15.6 Consumer2 0.1 +/- 0.1 0.6
Memory (GiB) Mean +/- Stddev Max Kafka 26.1 +/- 6.6 30.6 Zookeeper 0.08 +/- 0.01 0.08 Producer 0.02 +/- 0.02 0.09 Consumer1 0.009 +/- 0.0004 0.015 Consumer2 0.008 +/- 0.0002 0.009
Network in Mean +/- Stddev Max Kafka 2.08 +/- 0.58 MiBps 3.6 MiBps Zookeeper 81 +/- 97 Bps 1.2 KiBps Producer 11 +/- 3.3 KiBps 24.8 KiBps Consumer1 2.05 +/- 0.59 MiBps 3.5 MiBps Consumer2 2.01 +/- 0.56 MiBps 3.5 MiBps
Network out Mean +/- Stddev Max Kafka 4.03 +/- 1.10 MiBps 7.0 MiBps Zookeeper 49 +/- 79 Bps 966 Bps Producer 1.97 +/- 0.54 MiBps 3.5 MiBps Consumer1 23.7 +/- 6.5 KiBps 43.4 KiBps Consumer2 2.01 +/- 0.56 MiBps 3.5 MiBps
Cluster total IO Mean +/- Stddev Max read 1.25 +/- 4.27 KiB 75.2 KiB written 2.5 +/- 3.4 MiB 61.0 MiB
Cluster total network traffic Mean +/- Stddev Max received 6.4 +/- 1.0 MiBps 6.8 MiB transmitted 6.5 +/- 1.0 MiBps 6.8 MiB
The networking traffic pattern shows some burstiness seen in Figure 1. The bandwidth out is higher than in because this experiment has two consumers reading the full stream.
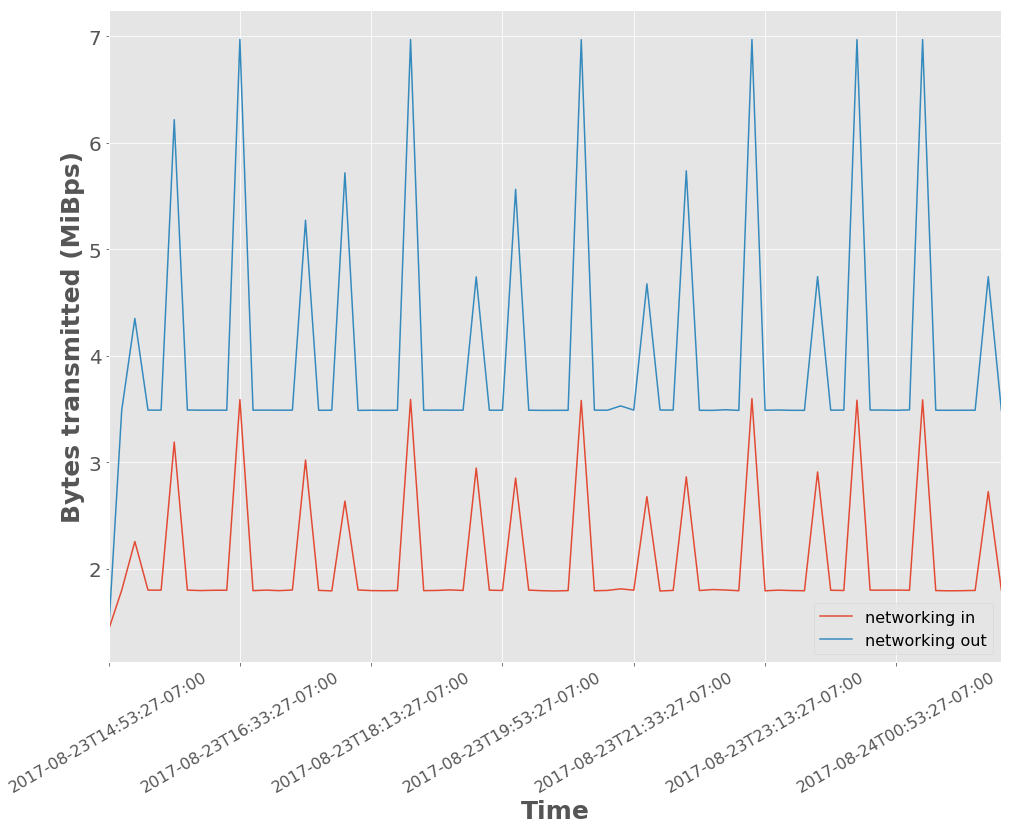
Figure 1 Network traffic in and out of Kafka. The x-axis ticks are demarcated at time intervals of 1 hour and 40 minutes.
Scaling Alert Volume
To complement the initial benchmarking experiment at ZTF scale and derive scaling curves, we ran several similar tests varying the total number of alerts produced per visit. We set the alert producer to serialize and produce 100, 1,000, and 10,000 alerts per visit and also ran each of those tests once including and once without including the postage stamp cutout files in the alert packets to further vary the volume of data sent per visit. The tests use the same testbed setup as the initial benchmark experiment, using Docker for AWS as described above, with again 3 Swarm managers and 5 Swarm worker nodes on r3.xlarge machines. For the larger experiments, we increased the instance ephemeral storage to the maximum of 1 TiB.
Results
Given the results from the initial benchmark, the most interesting metrics or where the Kakfa system uses a significant amount of resources are the timing metrics for serialization and for transportation of alerts, memory usage for Kafka, and network traffic in and out of the Kafka system.
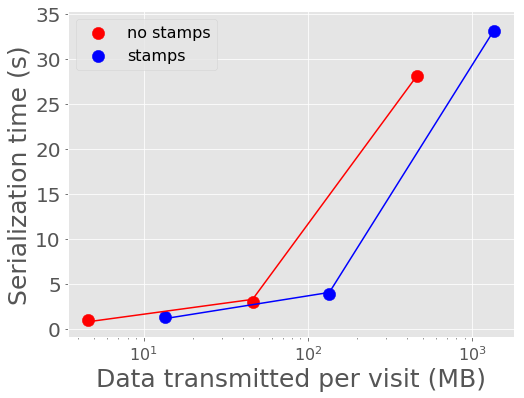
In Figure 2 and Figure 3, we show the mean time it takes to serialize into Avro format and send a batch of alerts to Kafka. 100 alerts takes about 1 second to serialize and send to Kafka, 1,000 alerts takes about 3-4 seconds, and 10,000 alerts takes about 28-33 seconds for a single producer. A single producer then can serialize about 300 alerts into Avro per second.
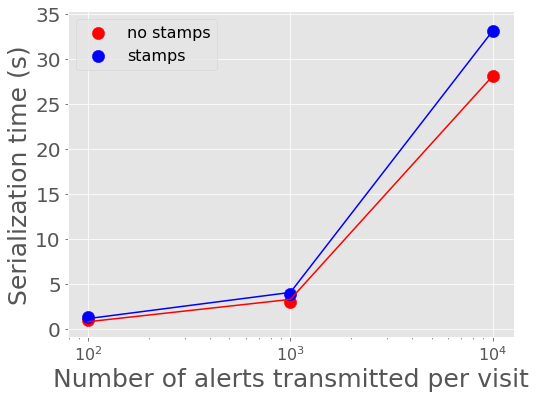
Figure 2 Alert serialization time vs number of alerts in a batch with best fit linear relations overplotted.
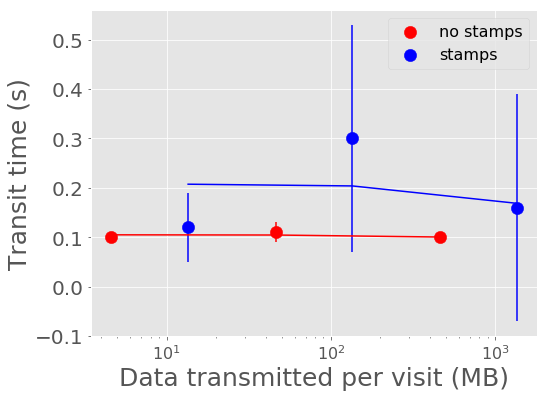
Figure 4 and Figure 5 show the mean time it takes for the last alert in a batch produced to be sent through Kafka and received by a consumer. For all experiments, the transport time is low, between 0.10 - 0.30 seconds. The time spent serializing alerts into Avro format on the producer end dominates over the transport time.
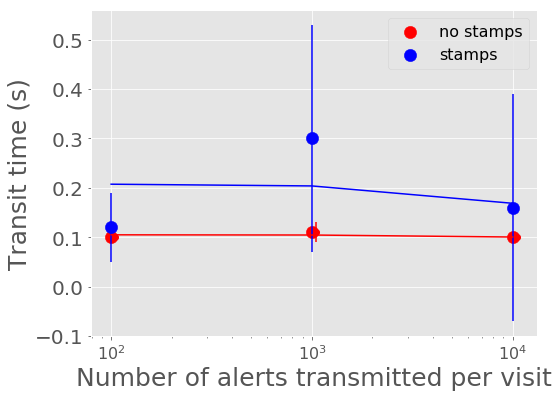
Figure 4 Alert transit time vs number of alerts in a batch with best fit linear relations overplotted.
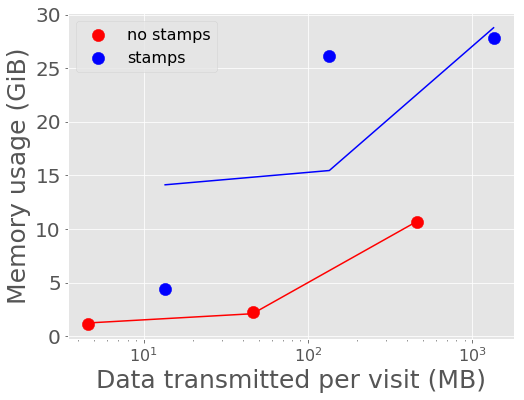
Figure 6 and Figure 7 show the average memory usage by Kafka over the length of each experiment. A back-of-the-envelope calculation for estimating memory needs says that if you want Kafka to buffer for 30 seconds then the memory need is write_throughput*30. If we say on average the alert throughput is at least 250 alerts/second (but really bursty and likely higher) then the memory estimate is 250 alerts/sec * 135 KB/alert * 30 seconds = 10+ Gigabytes. Memory usage increases more rapidly with data volume for the larger single alert size (including postage stamps), nearing the maximum for the compute instance size for 1,000 and 10,000 alerts per visit with stamps.
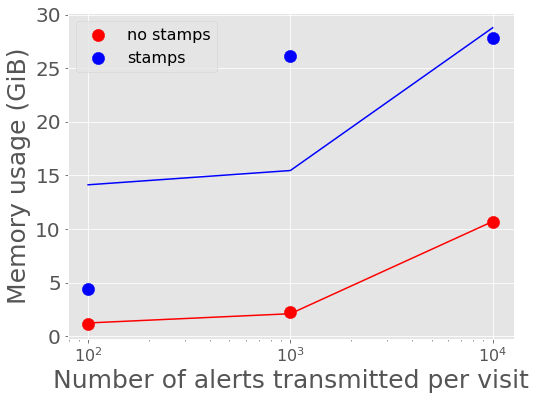
Figure 6 Kafka memory usage vs number of alerts in a batch with best fit linear relations overplotted.
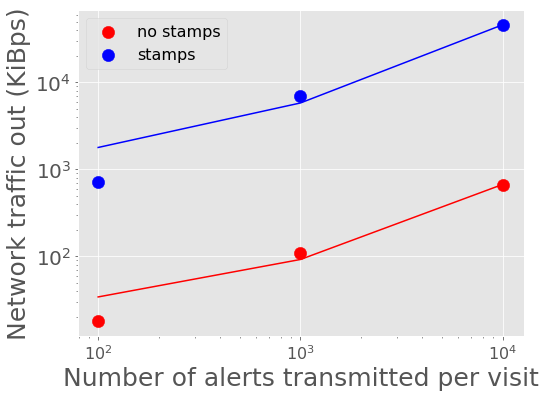
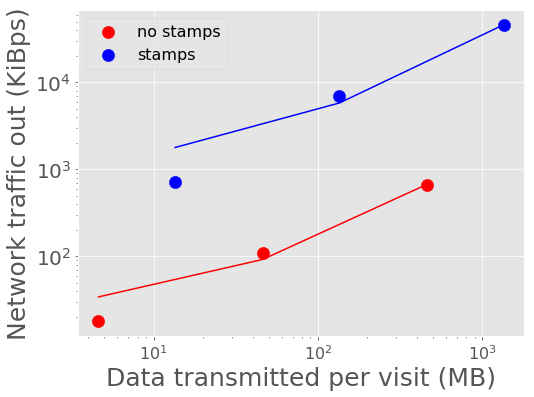
Figure 8 - Figure 11 show the peak network traffic in and out of the Kafka broker. For 10,000 alerts, the alert producer creates a peak of 23 MiBps into Kafka, and the two consumers double the network traffic out at 45 MiBps.
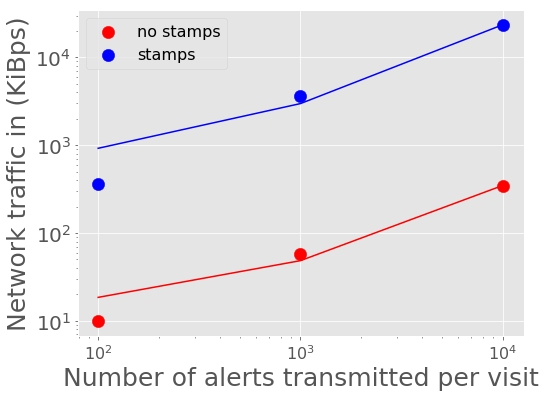
Figure 8 Network traffic into Kafka vs number of alerts in a batch with best fit linear relations overplotted.
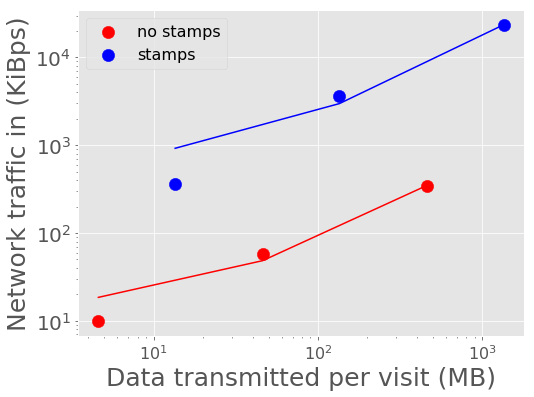
Figure 9 Network traffic into Kafka vs volume of data in a batch with best fit linear relations overplotted.
Scaling Producers and Consumers
To be completed.
